牛津仪器集团成员
扩展

Imaris Start

The Imaris Start Package is an interactive visualization and analysis software for 3D and time-lapse microscopic images with advanced solutions for big datasets (Terabyte range) - smart Volume and Surface rendering based on our multi-resolution technologies, plus Surface calculations for images of unlimited size. Imaris Start Package is perfect for researchers who need an easy to use software for making stunning Snapshots and Animations, generating quantitative information from their microscopy data, co-localization studies, plotting and statistical analysis.

Request Pricing

Visualization  and animation export

Imaris provides a complete set of features for visualization of multi-channel microscopy datasets from static 2D images to 3D time series regardless of their size and format. Using Imaris for Cell Biologists users can:

  • Organize and manage full experiments including images and data analysis in Imaris Arena
  • Use premier 3D/4D volume rendering modes: (MIP, Blend, Shadow Projection, Normal Shading)
  • Benefit from Imaris’ high performance IMS file format which guarantees smooth navigation even in very large datasets
  • Combine volume rendering, object representation, clipping planes and 2D slicers
  • Make high quality snapshots ready for presentations and publications in Snapshot Tool
  • Easily make animations which include volume rendering, detected objects, annotations and object motion by adding several frames of interest in the Key Frame Animation Tool
 

Automated detection of cells and organelles

Imaris for Cell Biologists provides multiple options to detect and model your biologically relevant structures via step-by-step wizards with a preview of the results at each point in the workflow.

Surfaces

Use Imaris 3D Surfaces to precisely visualize and measure shapes of various objects within your samples such as organelles, nuclei, biofilms, cells, tissues, organs, embryos, tissues as well as whole organisms.

 
  • Representations of a specified region of interest in the data set
  • Calculated based on global or local threshold or created based on user-defined regions of interests
  • Can be calculated and visualized for data sets up to terabytes in size
  • Act as a container from which all the desired statistics can be calculated

Spots

Use Imaris Spots to detect: particles, protein clusters, vesicles, nucleoli, nuclei, centrosomes, cells and bacteria.

 
  • Model point-like or vesicle-like structures in the data.
  • Can be identified in images with 10s or 100s of thousands of objects.
  • XYZ coordinates of each objects are calculated, relative distances to other objects can be measured
  • Can be tracked in time (5 high performance motion algorithms)

Plotting, statistical tests and group comparisons

Imaris for Cell Biologists includes a seamlessly integrated tool to explore differences between experimental groups (e.g. control vs test) - ImarisVantage. It allows for the creation of interactive plots which help illustrate relationships/patterns/differences amongst object measurement or groups of objects and reveal hidden relationships.

Scatterplot

  • Explore hidden relationships within your data by plotting them on the 2D/3D interactive Vantage plot
  • Select up to five measurements which will be represented within x, y, z axes, size and color
  • Select objects of interest within the Vantage plot and explore them in the 3D space
 

Group Comparison (3D)

  • Apply an image analysis protocol to multiple datasets of the same type (i.e. control and test groups)
  • Upload objects from multiple datasets to the same Vantage plot
  • Compare measurements amongst groups by selecting different measurements for the axes
 

Statistical Tests

  • Create single-dimension univariate scatterplots for a selected measurement from one or more images or group of images
  • Report the results of pairwise: T-test, F-test, Kolmogorov-Smirnov and Wilcoxon
  • Export your plots in a ready to use format for papers and presentations
 

Co-localization

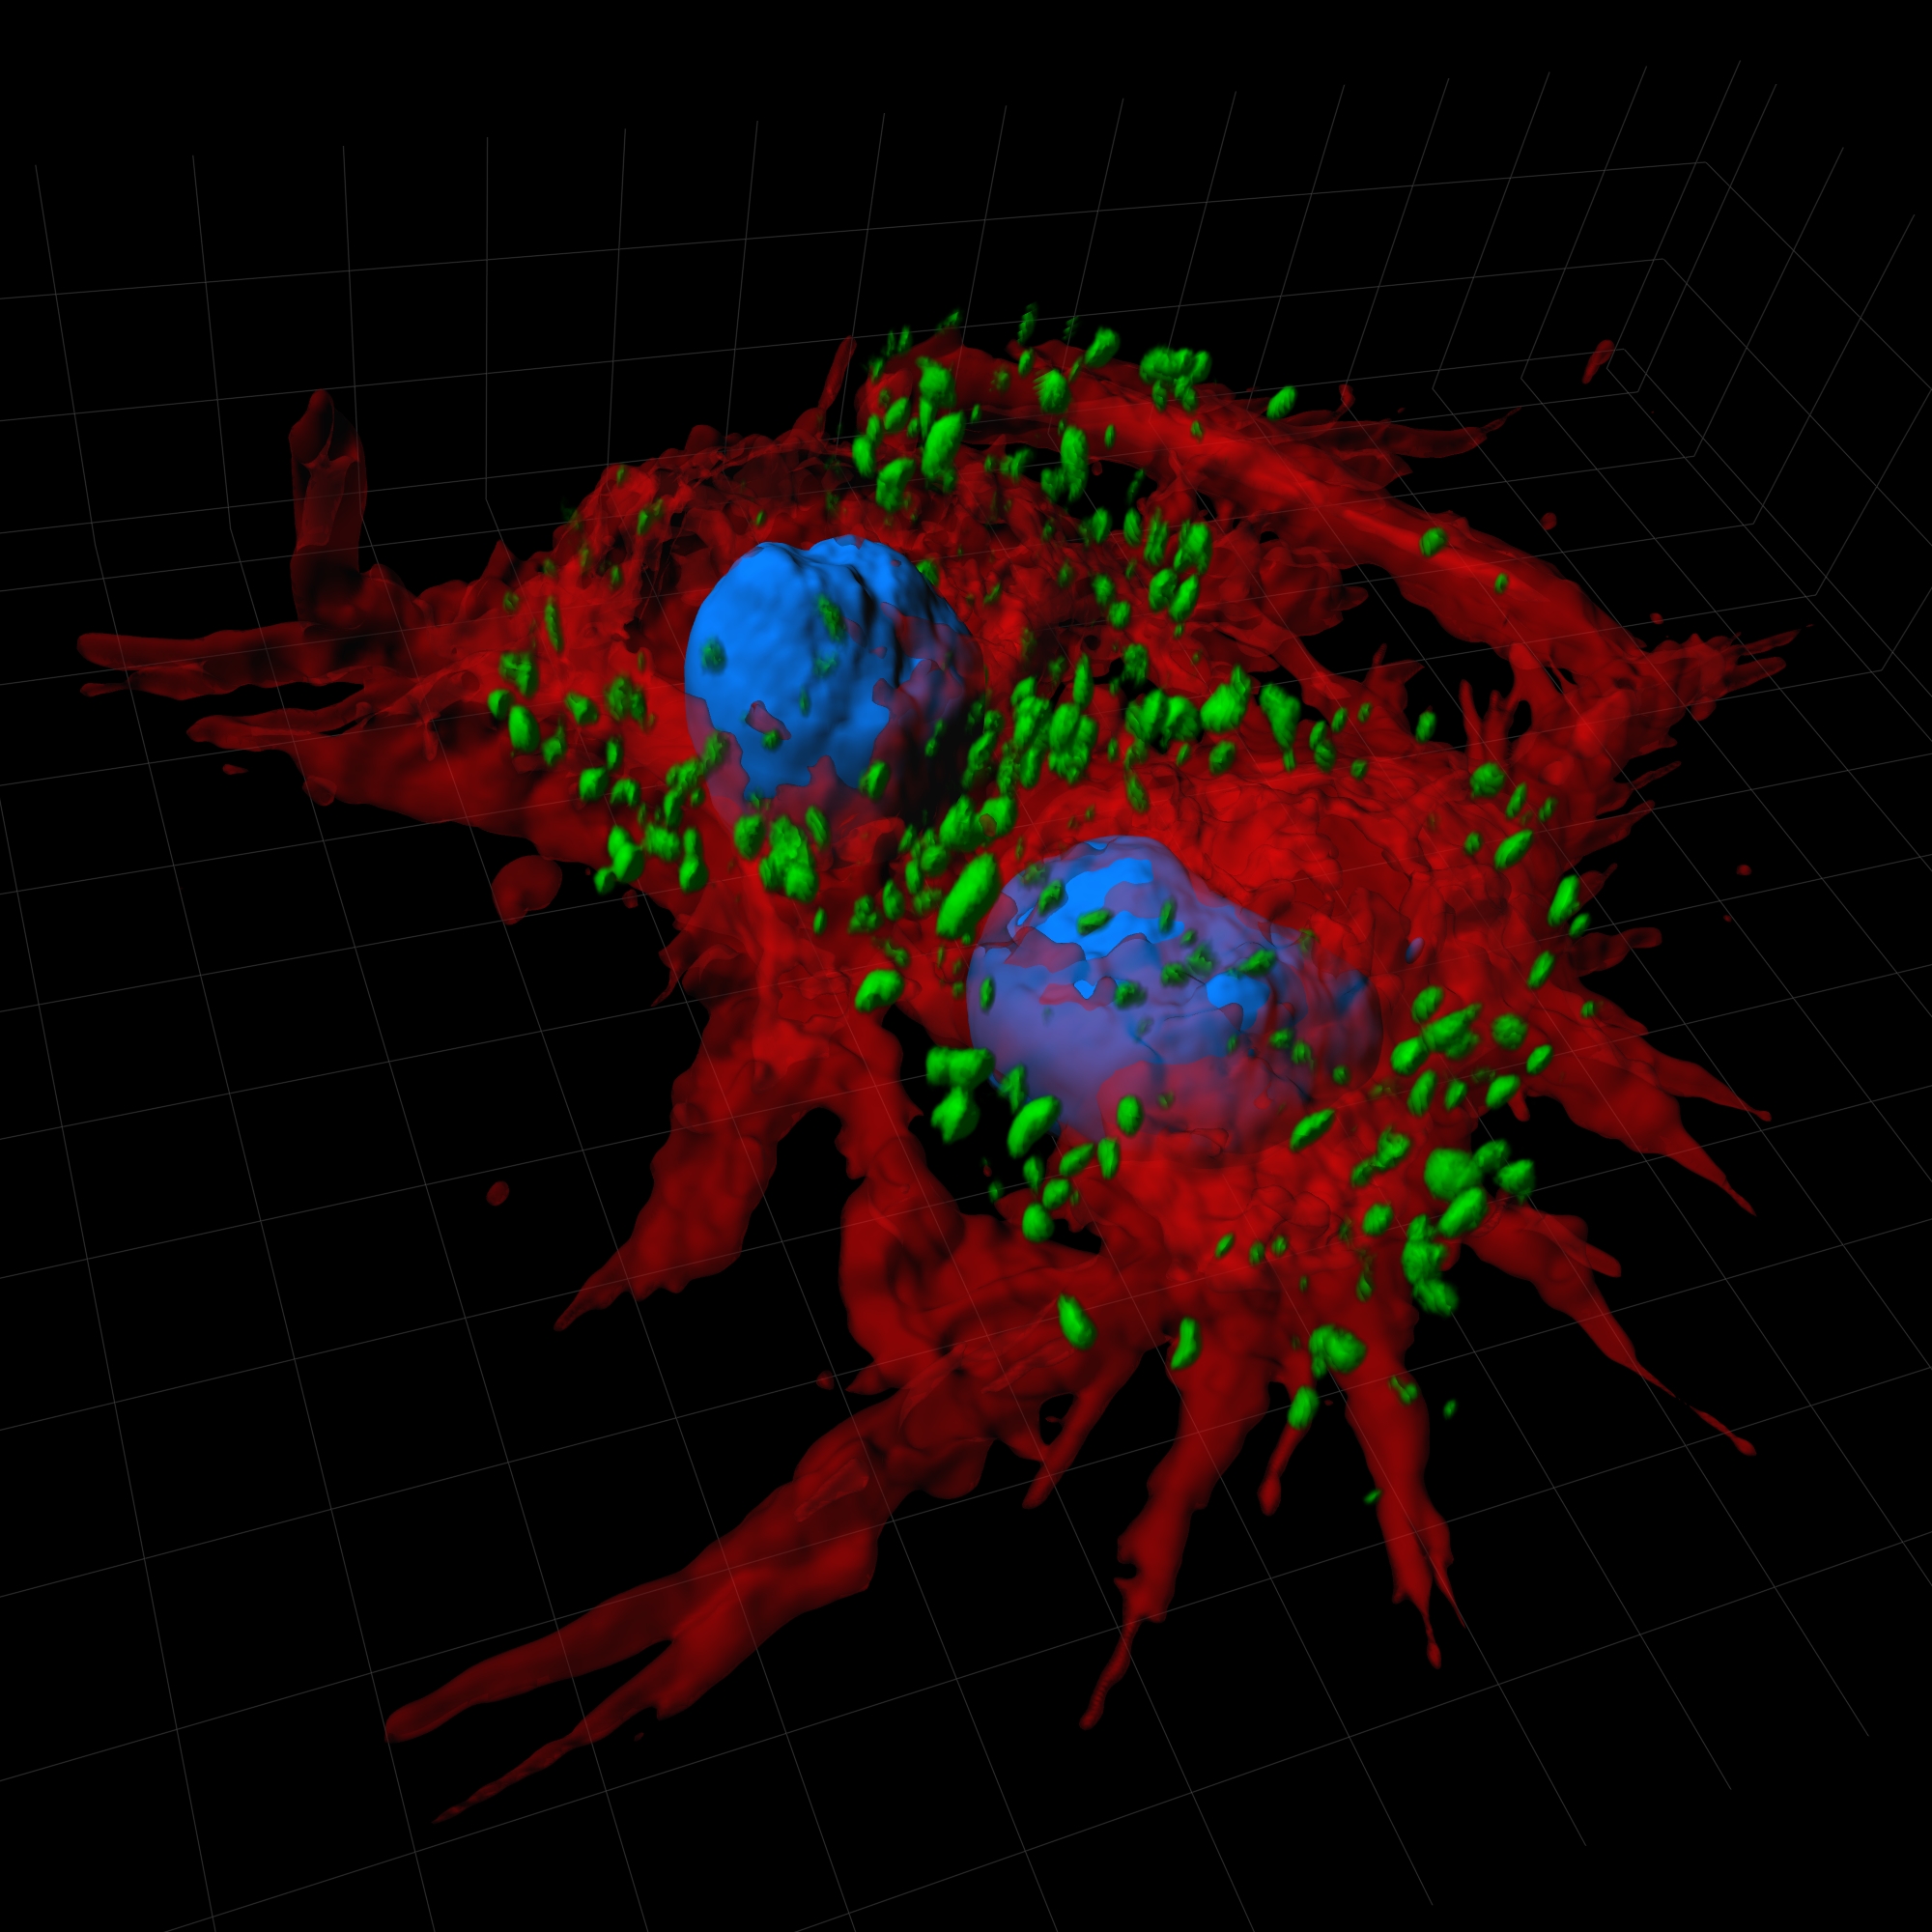
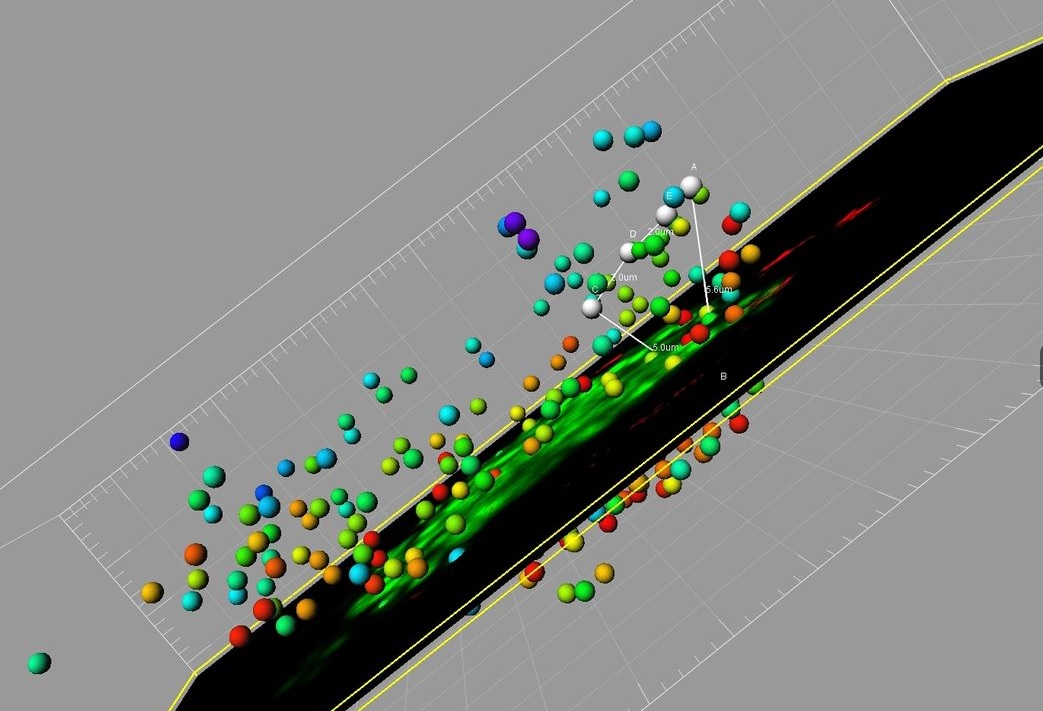
ImarisColoc is the most powerful co-localization analysis tool to quantify and document co-distribution of multiple stained biological components.

  • Co-localization available for 2D, 3D data and time series
  • Regions can be presented as new 3D or 4D color channel
  • Users can expand or narrow the region from which histograms for co-localization are computed

Automatic calculation of: Pearson’s coefficient, Mander’s coefficient, co-localized voxels, co-localized percentages


Additional Resources

The Imaris Learning Center hosts a wide range of tutorial videos, how-to articles and webinars to guide you through the many features of Imaris. We have provided some links below which will get you started on some of our most recent developments.

沪ICP备17031777号-1 公安机关备案号31010402003473